Janet Yellen, the former Federal Reserve Chair, often said that “monetary policy is not a panacea.”1 Much like the common cold, which must run its course while symptoms are managed, the Fed's tools are often unable to fix the economy's underlying issues. In theory, monetary policy is designed to ease these challenges, particularly regarding employment and inflation. In practice, however, the Fed does not directly control the economy. It responds to economic conditions as they develop.
The primary challenge today is persistent inflation. This is largely attributable to elevated oil prices as the war in Iran continues, prolonging the closure of the Strait of Hormuz and compounding other regional difficulties. The Fed clearly cannot resolve these geopolitical issues through interest rate policy. What it can do is work to prevent inflation from spreading beyond energy prices into other categories that affect consumers and businesses. Understanding the Fed through this lens raises an important question for long-term investors: how should these developments shape portfolio decisions?
Markets had already priced in the Fed's most recent rate hike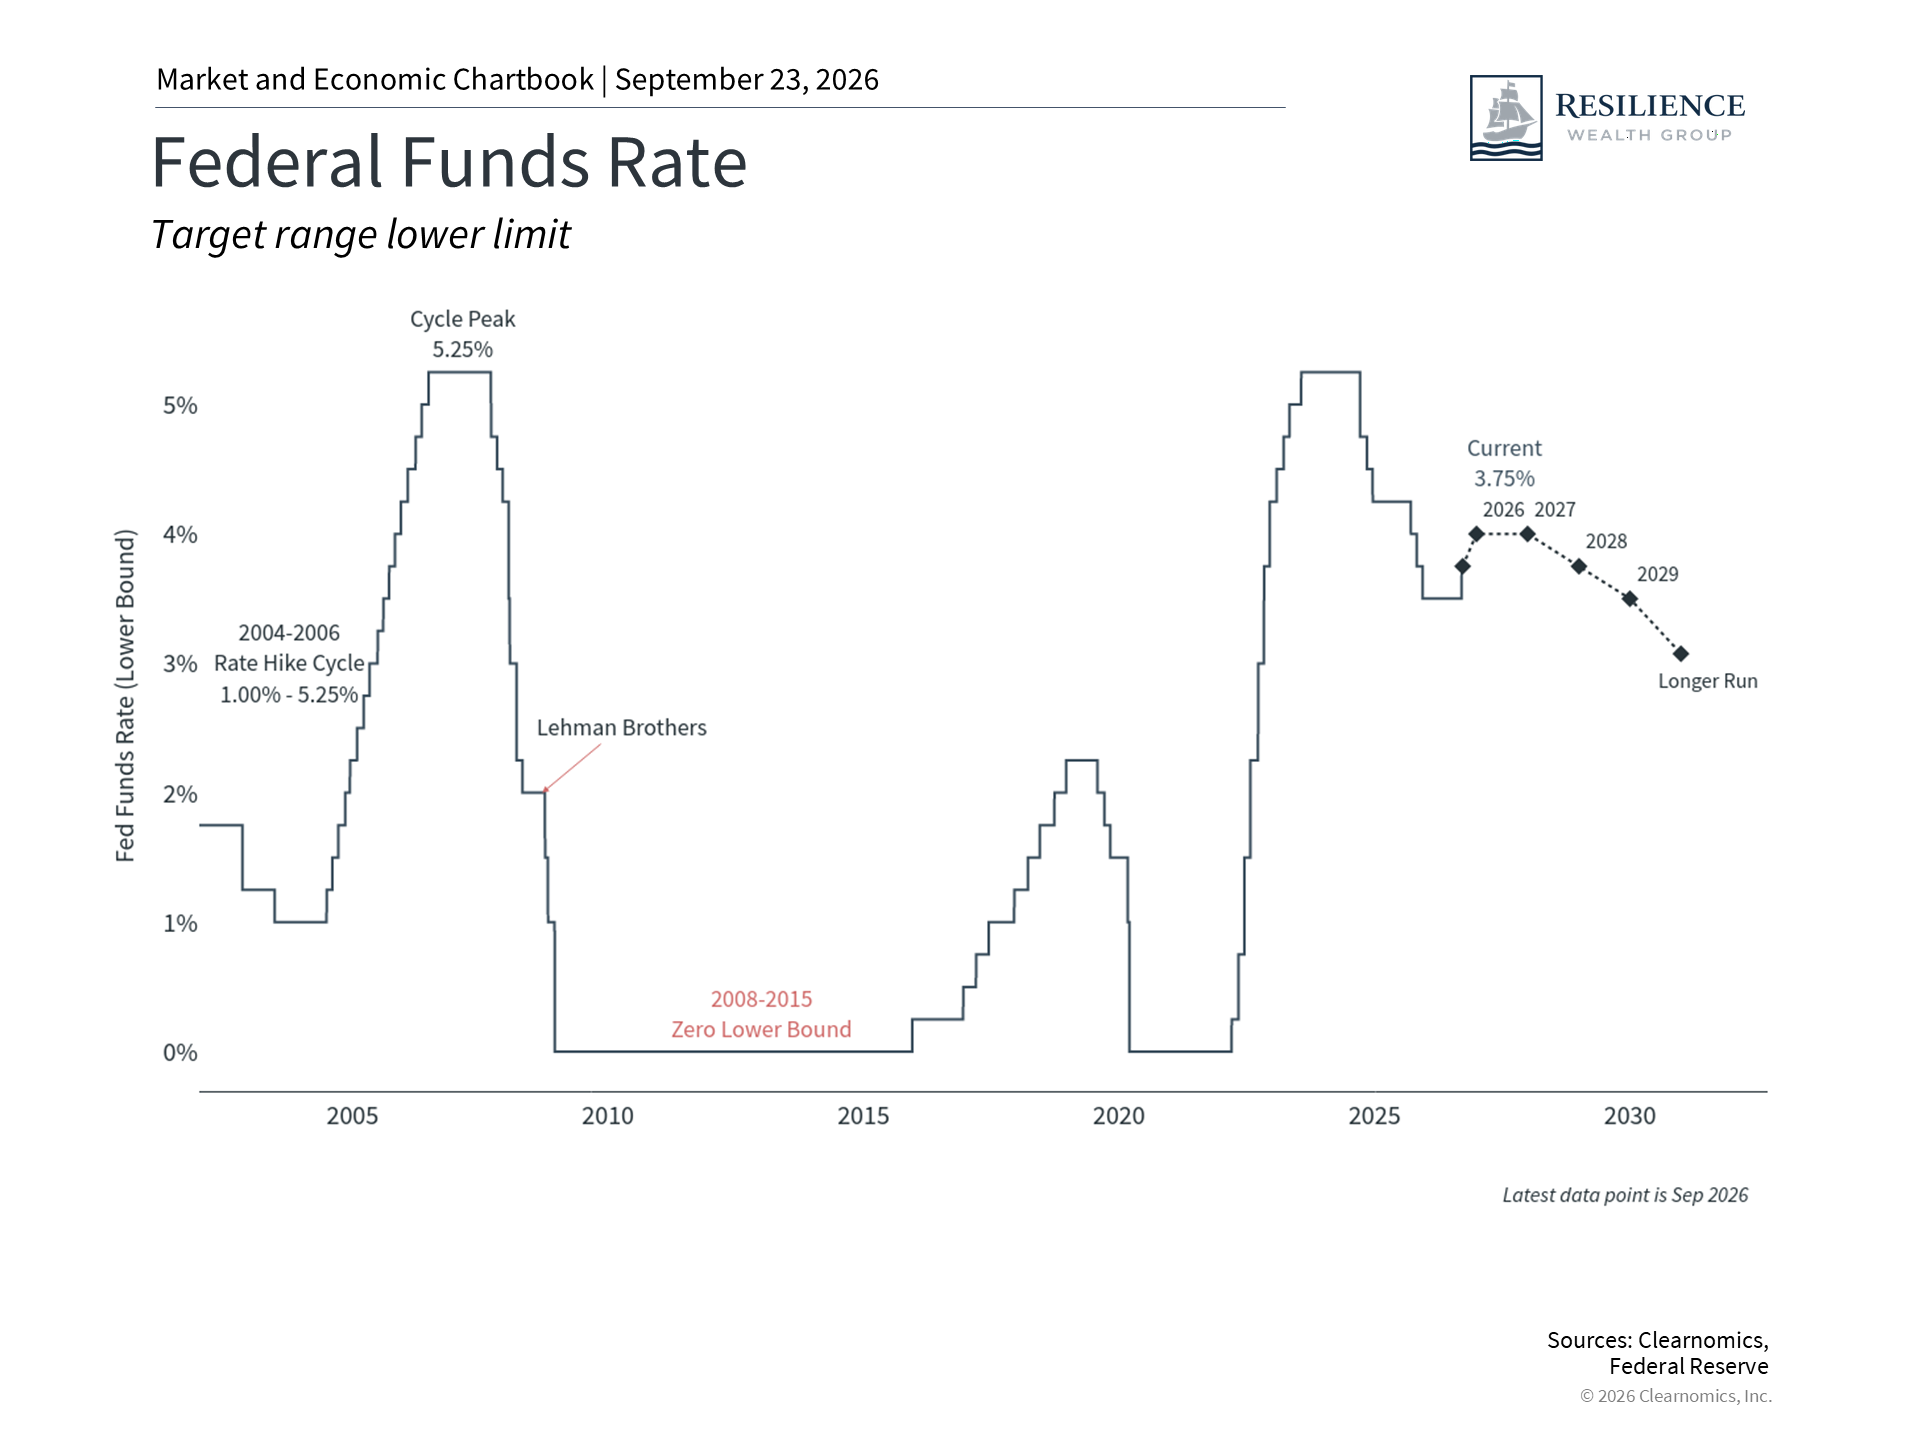 |
At its September meeting, the Fed chose to raise policy rates by one-quarter of a percent, bringing the target range to 3.75% to 4.00%. This marked the first rate hike in three years, following a period of rate cuts that ran from September 2024 through December 2025. Because investors had broadly anticipated this decision, markets experienced some brief volatility immediately following the announcement but largely absorbed the move without significant disruption.2
What distinguishes this particular hike is that the Fed is primarily responding to elevated energy prices, with oil still trading near $100 per barrel. Economists often describe this dynamic as “cost-push inflation,” meaning that supply disruptions have driven prices higher. This stands in contrast to “demand-pull inflation,” which occurs when an overheating economy generates excessive consumer demand that then pushes prices upward.
In 2022, both dynamics were present simultaneously. Low interest rates and government stimulus fueled demand-side inflation, while pandemic-related supply disruptions and Russia's invasion of Ukraine created supply shocks. Supply-side shocks are generally viewed by economists and policymakers as temporary, since the underlying causes tend to resolve over time. In the case of oil, prices did eventually decline before this year's geopolitical developments reversed that trend.
Over recent policy cycles, the Fed has favored a steady, well-communicated approach to rate changes. This practice, commonly known as “forward guidance,” was intended to offer clarity on the likely path of interest rates, particularly during periods of economic stress. New Fed Chair Kevin Warsh, however, has moved away from this approach and has declined to submit his own forecasts to the Fed's quarterly Summary of Economic Projections.3
His preference is for markets to respond to the underlying economic data rather than to signals about the Fed's next move. This approach helps explain why investors assigned over a 90% probability to this rate hike before the meeting even took place.4 Whether or not one considers this the right approach, it places greater importance on monitoring labor market conditions, inflation trends, and economic growth directly. While inflation remains elevated relative to many forecasters' preferences, unemployment is still near historically low levels and GDP growth has remained steady.
Rate hike cycles are a routine feature of the economic landscape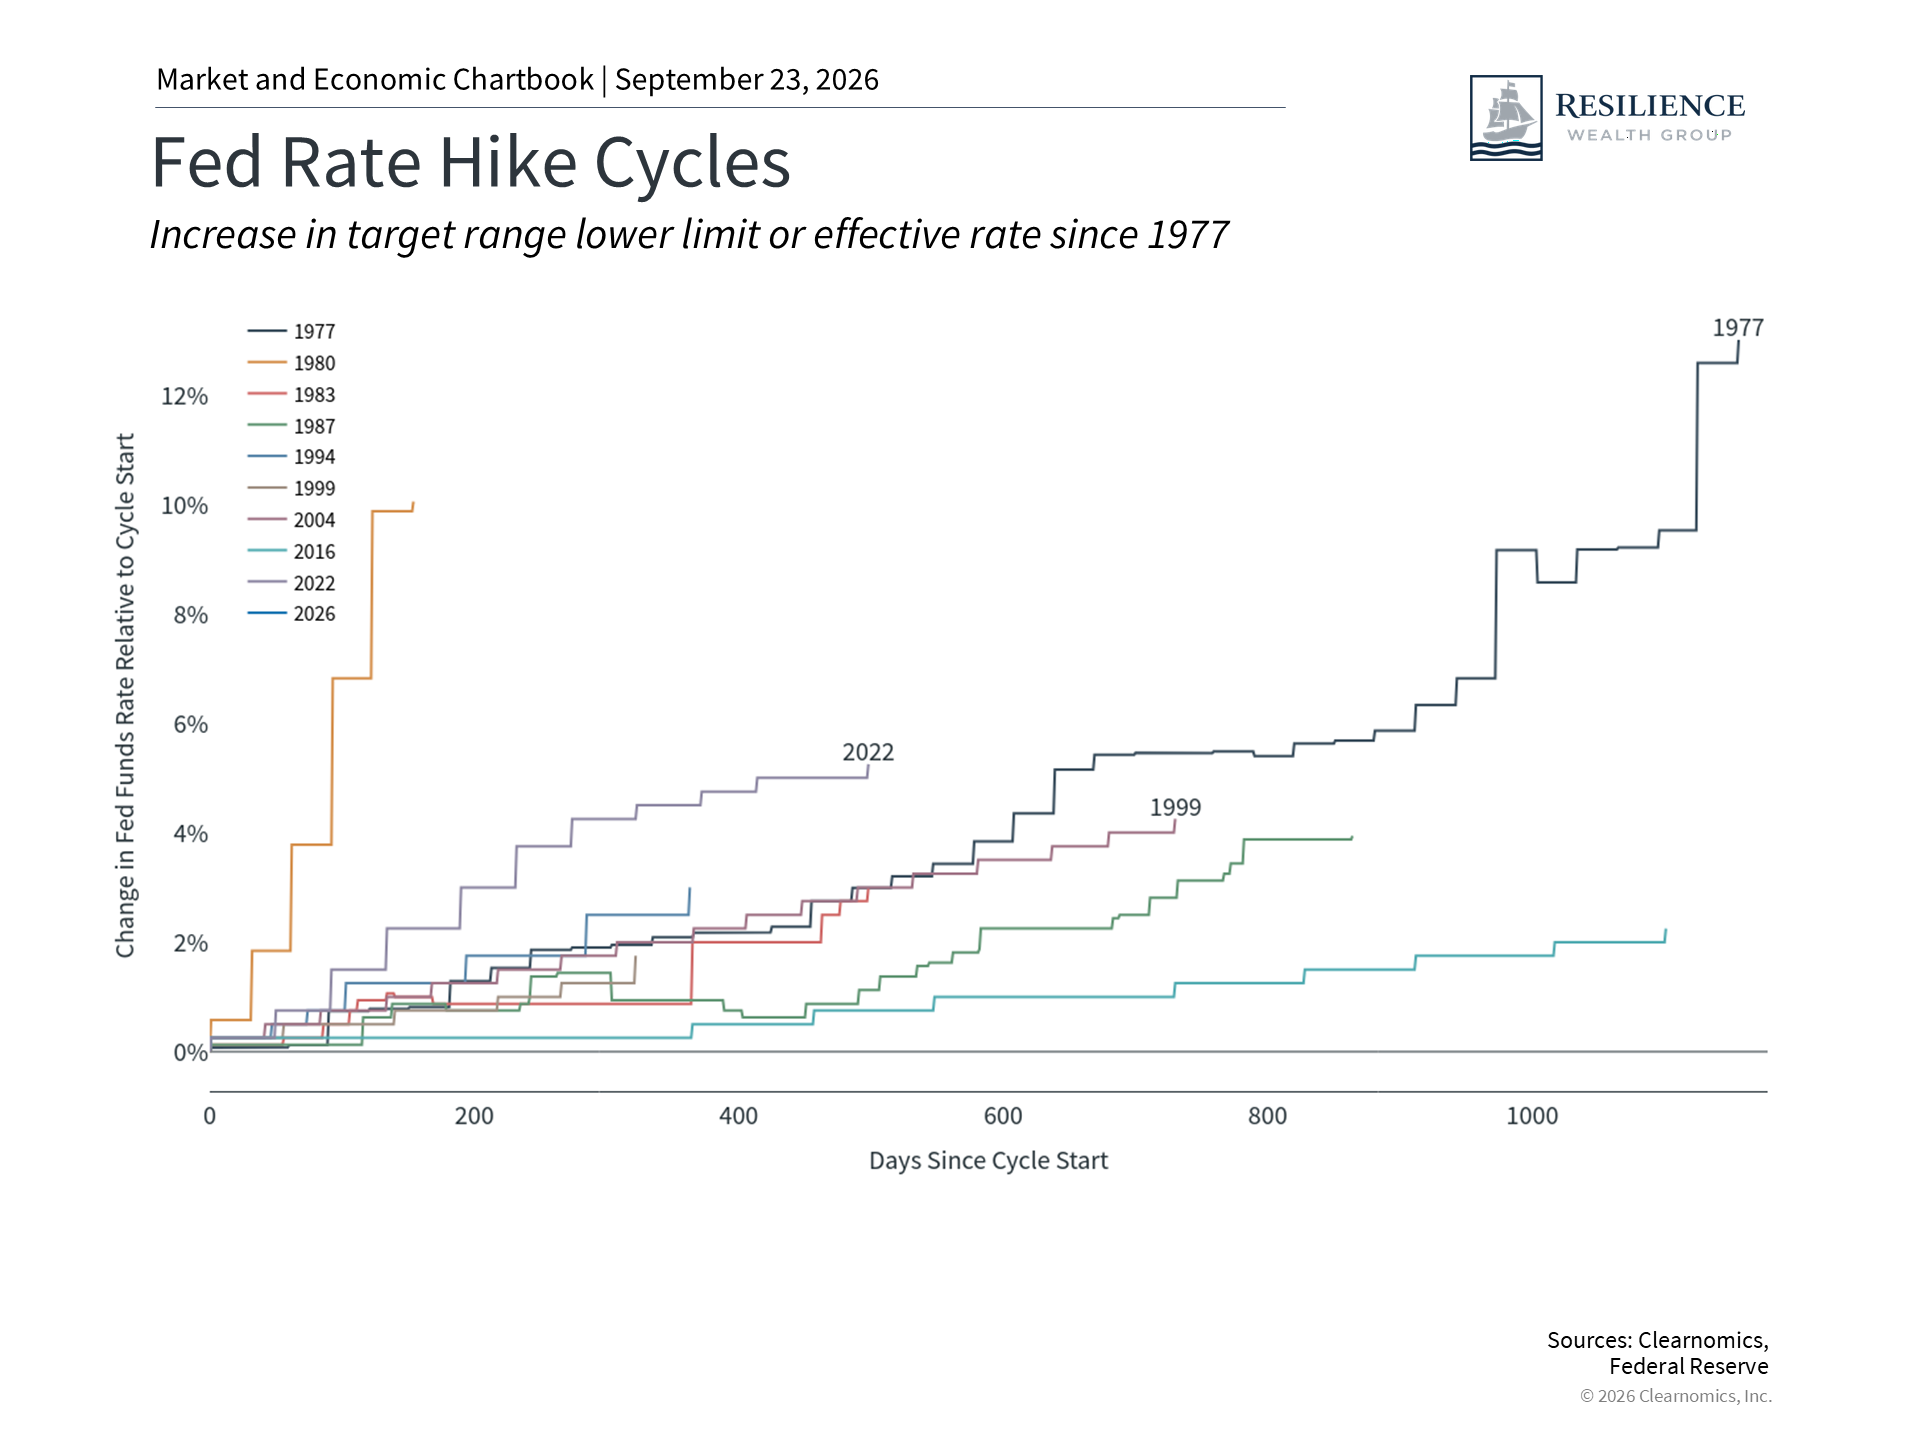 |
The modest 0.25% increment reflects the current balance of conditions. Projections from other Fed officials suggest the central bank may raise rates once more later this year before pausing through 2027, with only a gradual decline expected thereafter. This represents a shift from the Fed's June forecasts, which had anticipated lower rates. That said, these projections should be interpreted cautiously, as they can shift meaningfully from one meeting to the next depending on how the underlying economic data evolves.
It is understandable that some investors associate rising interest rates with negative outcomes for markets. In reality, the relationship depends heavily on the reason behind the rate increases. It is not unusual for both markets and interest rates to rise together, particularly in the later stages of a business cycle.
A growing economy paired with strong corporate earnings can support rising stock prices even as the Fed works to keep inflation in check. Over the past six months, major indices including the S&P 500, the Dow Jones Industrial Average, and the Nasdaq have all moved toward new all-time highs, supported by robust corporate earnings and investment in AI data center infrastructure, even as interest rates have reached multi-decade highs.
There is also a common misconception that the Fed's role is to fine-tune the economy with precision. This view was reinforced in part by the Fed itself, particularly during Alan Greenspan's tenure from the late 1980s through the mid-2000s, when the central bank's deliberations were relatively opaque. In practice, the Fed is more often reacting to events than steering the economy from a position of control. The chart above illustrates how rate hike cycles have unfolded across a wide range of economic environments, highlighting that these moves typically play out over extended periods.
Remaining invested is the most effective long-term response to inflation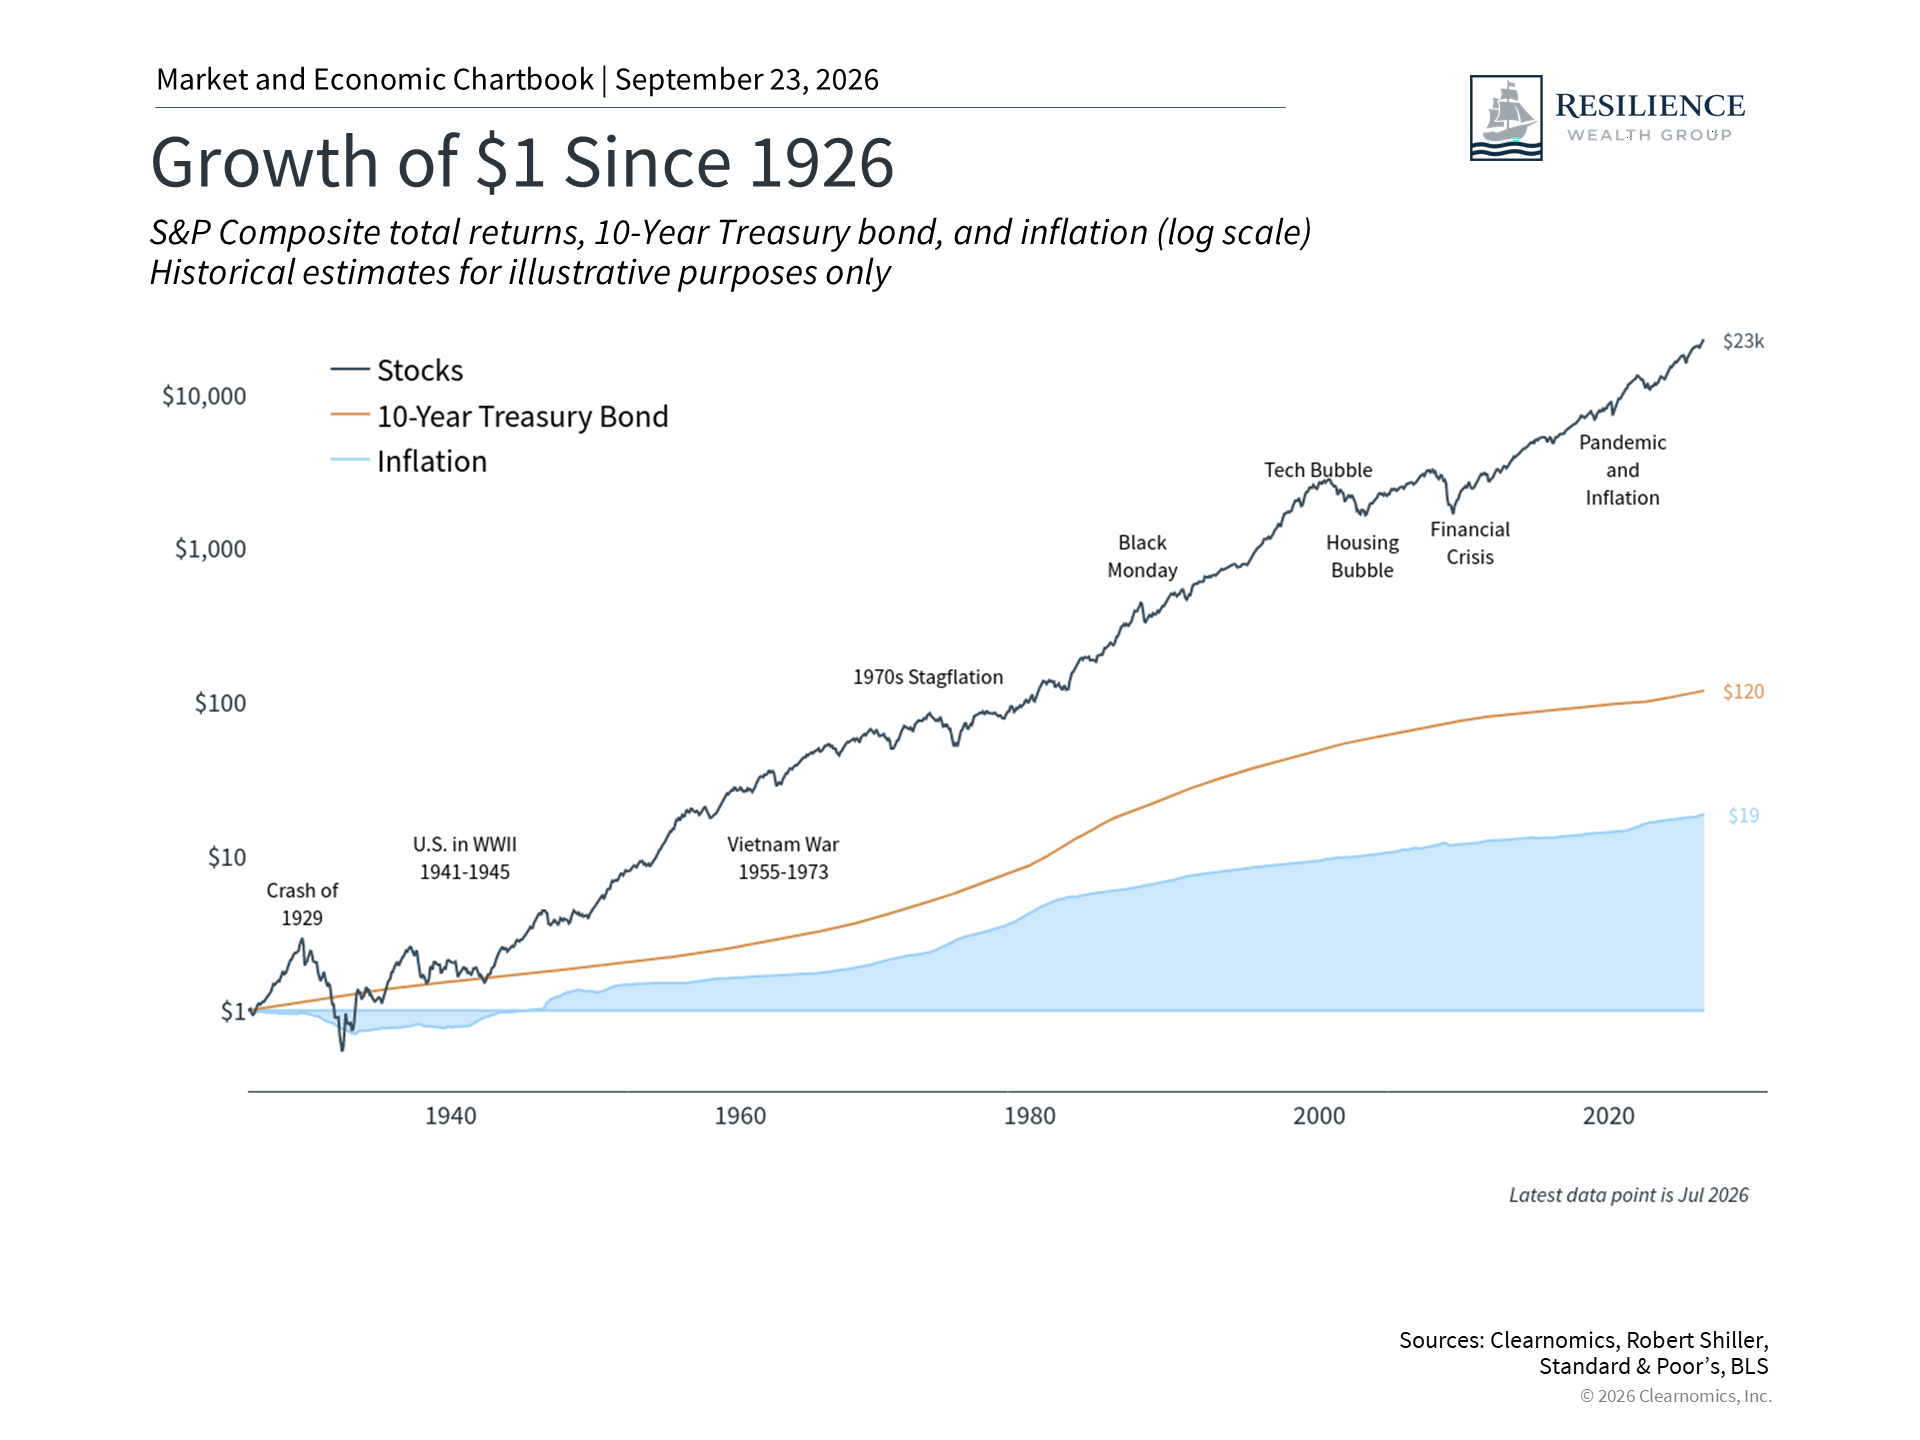 |
At the end of the day, investors pay close attention to Fed policy and interest rates because of the potential impact on their portfolios and financial plans. While Fed decisions attract considerable media coverage, they represent only one piece of a much larger picture.
The accompanying chart illustrates how financial markets have supported investors over the past century, through countless Fed decisions, economic shocks, recessions, geopolitical challenges, and other significant events. During this period, inflation pushed costs higher by 19 times, meaning that what cost $1 in 1926 costs $19 today. Despite this, both stocks and bonds significantly outpaced inflation over the long run. For those who remained invested, this dynamic supported portfolio growth, income generation, and long-term wealth creation.5
Of course, markets do not move in straight lines, and investors should always be prepared for periods of uncertainty. This is precisely why maintaining a portfolio that is aligned with long-term financial goals remains far more important than attempting to predict or time the Fed's next policy move.
The bottom line? The Fed's latest rate hike reflects inflation driven by higher oil prices. Investors are best served by focusing on long-term goals and maintaining balanced portfolios rather than reacting to each Fed decision.
References
1. https://www.federalreserve.gov/newsevents/speech/yellen20170303a.htm
2. https://www.federalreserve.gov/monetarypolicy/files/monetary20260916a1.pdf
3. https://www.federalreserve.gov/newsevents/speech/warsh20260828a.htm
4. Clearnomics research and CME Group data, as of September 16, 2026
5. Clearnomics research using Bureau of Labor Statistics and Standard & Poor's data, as of September 18, 2026
Index Descriptions
S&P 500
The Standard & Poor's 500 Index is a capitalization-weighted index of 500 stocks designed to measure performance of the broad domestic economy through changes in the aggregate market value of 500 stocks representing all major industries. The modern design of the S&P 500 stock index was first launched in 1957. Performance prior to 1957 incorporates the performance of the predecessor index, the S&P 90.