The housing market holds significance both at the personal level and for the wider economy and financial system. For many households, homeownership is a major milestone that takes years of planning and saving to achieve, representing their largest asset, most significant monthly expense, and primary source of debt. The housing market also constitutes a substantial portion of overall economic activity, accounting for between 15% and 18% of the country's GDP.1 When combined with the wealth effect that the housing market generates, these factors have the potential to influence consumer sentiment, household balance sheets, and the pace of broader economic growth.
Interest rates are one of the most direct influences on the housing market. When rates climb, mortgage costs for new applicants rise accordingly, affecting everything from loan qualification to the overall volume of home sales. The average 30-year fixed mortgage rate has moved back above 7% after briefly declining toward 6% at the start of the year. Although mortgage rates have experienced notable volatility in recent years, they have not remained at these levels on a sustained basis in nearly 25 years. What do these pressures in the housing market mean for households and the economy at large?
Mortgage rates have climbed back above 7%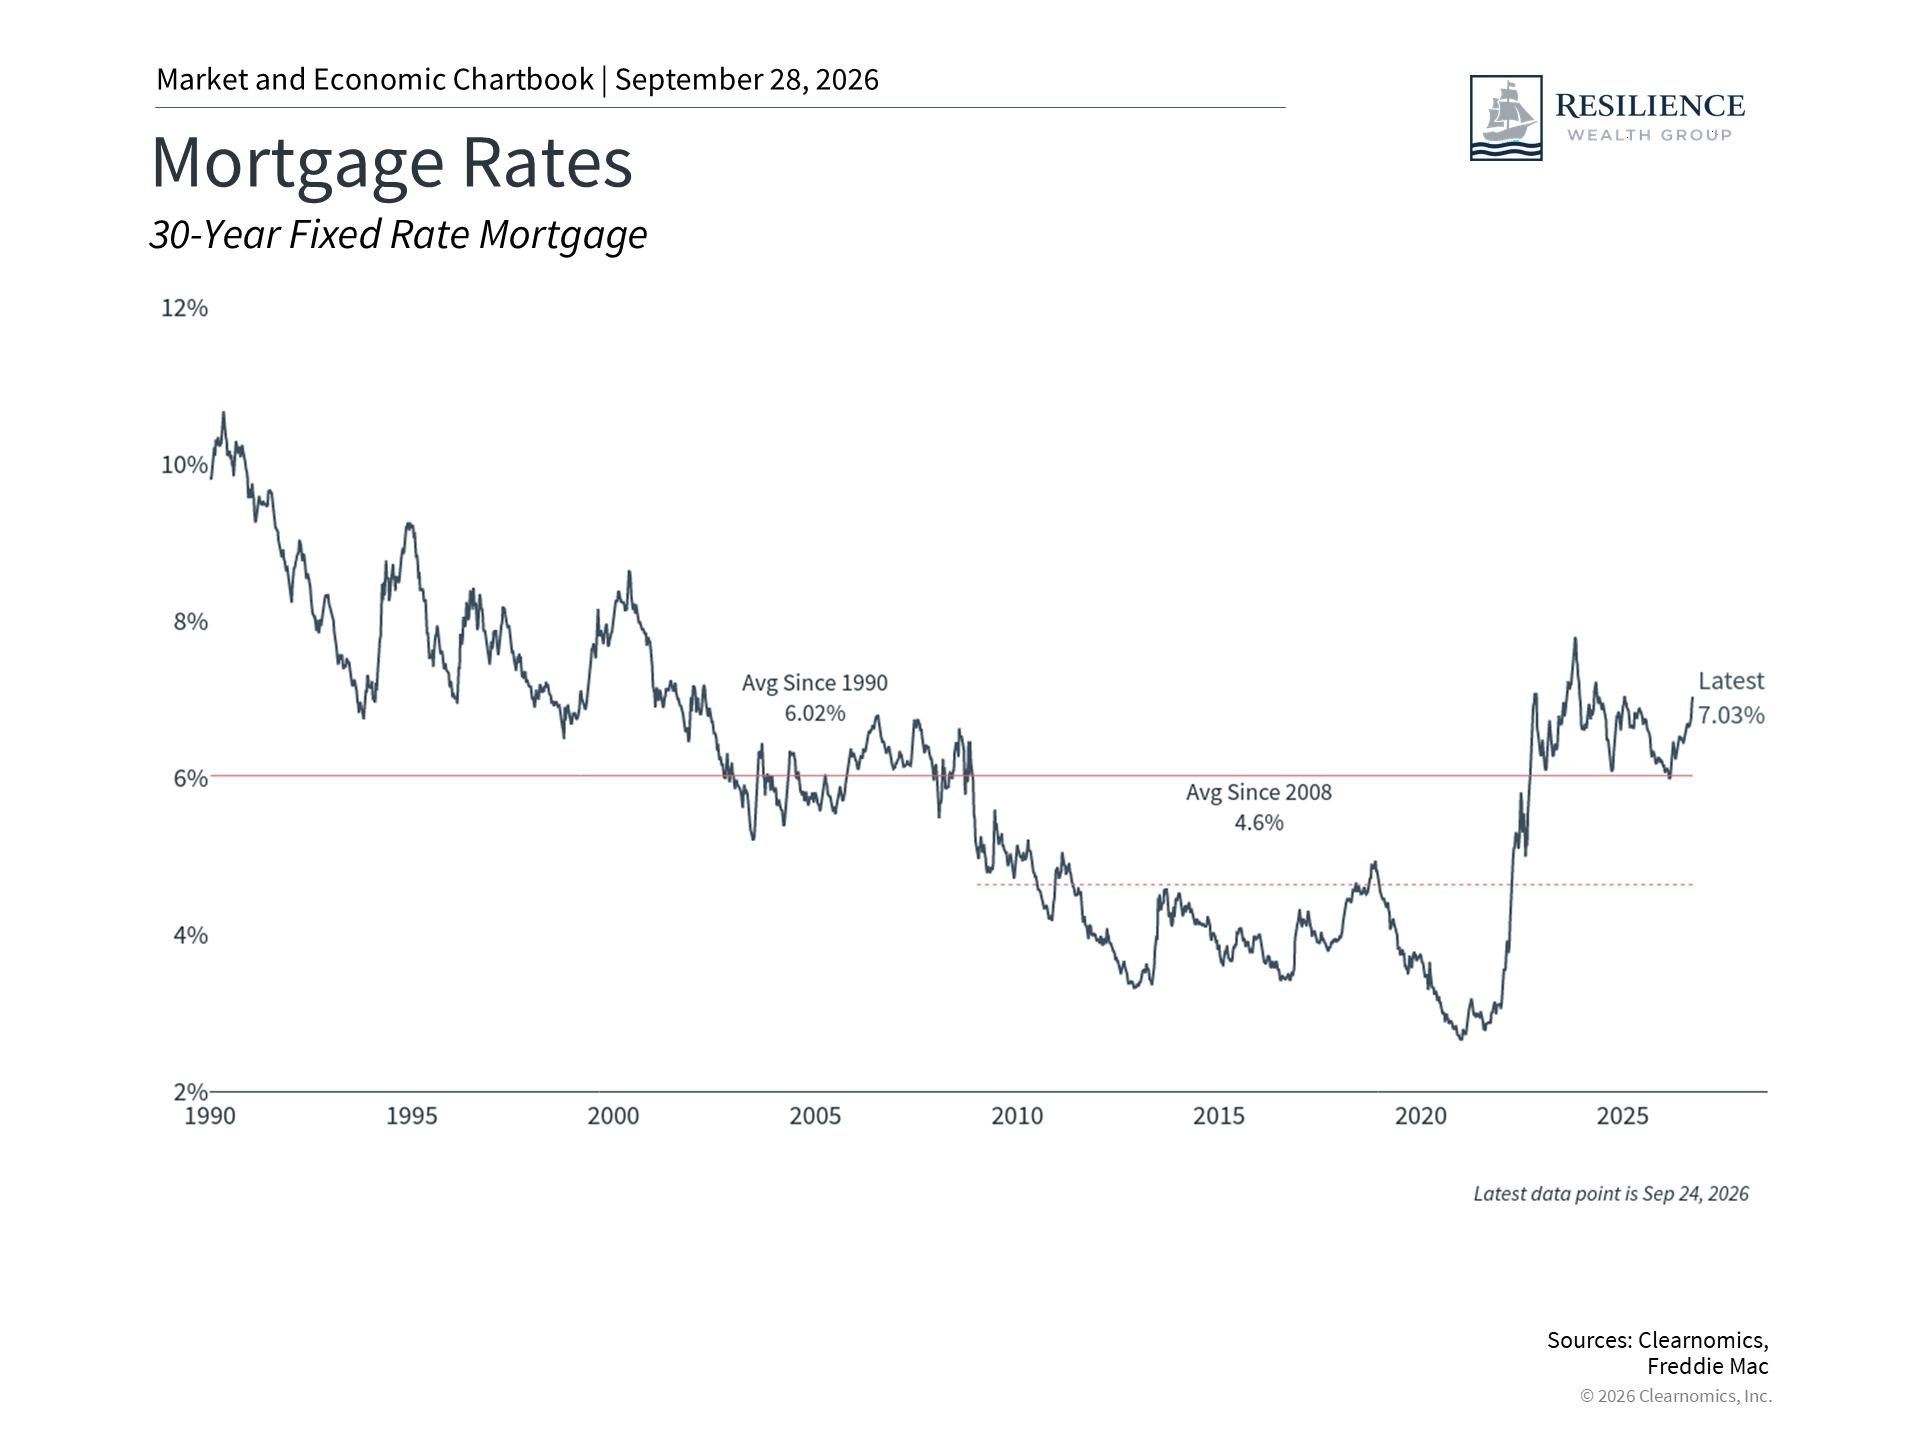 |
Mortgage rates had been on a long downward trend alongside long-term Treasury yields from the early 1980s through 2020, when they reached their lowest point during the pandemic. From 1990 to the 2008 financial crisis, the long-run average for 30-year fixed rates stood at 6%. By contrast, the average since then has been only 4.6%. During much of the past decade, and especially during the pandemic years when rates fell to 3% or below, many buyers and homeowners grew accustomed to financing costs that were well below historical norms.
The return to 7%, therefore, raises important questions about the economics of homeownership. One of the most significant consequences is what economists describe as the "lock-in" effect. Homeowners who secured low fixed rates in prior years face a strong disincentive to sell their homes, since doing so would mean taking on a new mortgage at today's considerably higher rate. This reduces the supply of existing homes coming to market and can keep transaction volumes subdued. Washington policymakers are even exploring potential solutions such as "portable mortgages" that would allow homeowners to transfer their lower rates to new homes.
According to the National Association of Realtors, existing home sales fell 2.0% month-over-month and 1.2% year-over-year in August, reflecting continued softness in market activity.2 The inventory of existing homes now stands at 4.9 months of supply, while new homes now stand at 8.5 months, the highest levels in over a decade.3 Although higher inventories are a positive development, these figures are calculated based on the current pace of sales activity, which means they could also reflect homes sitting on the market for longer periods.
For buyers who do enter the market, it is evident that higher rates have a direct effect on affordability, as a larger share of monthly income must be directed toward mortgage debt service. This gives prospective buyers a reason to wait for rates to improve, further delaying housing activity and forcing difficult tradeoffs when it comes to location, size, or down payment.
Home prices remain near record highs despite sluggish activity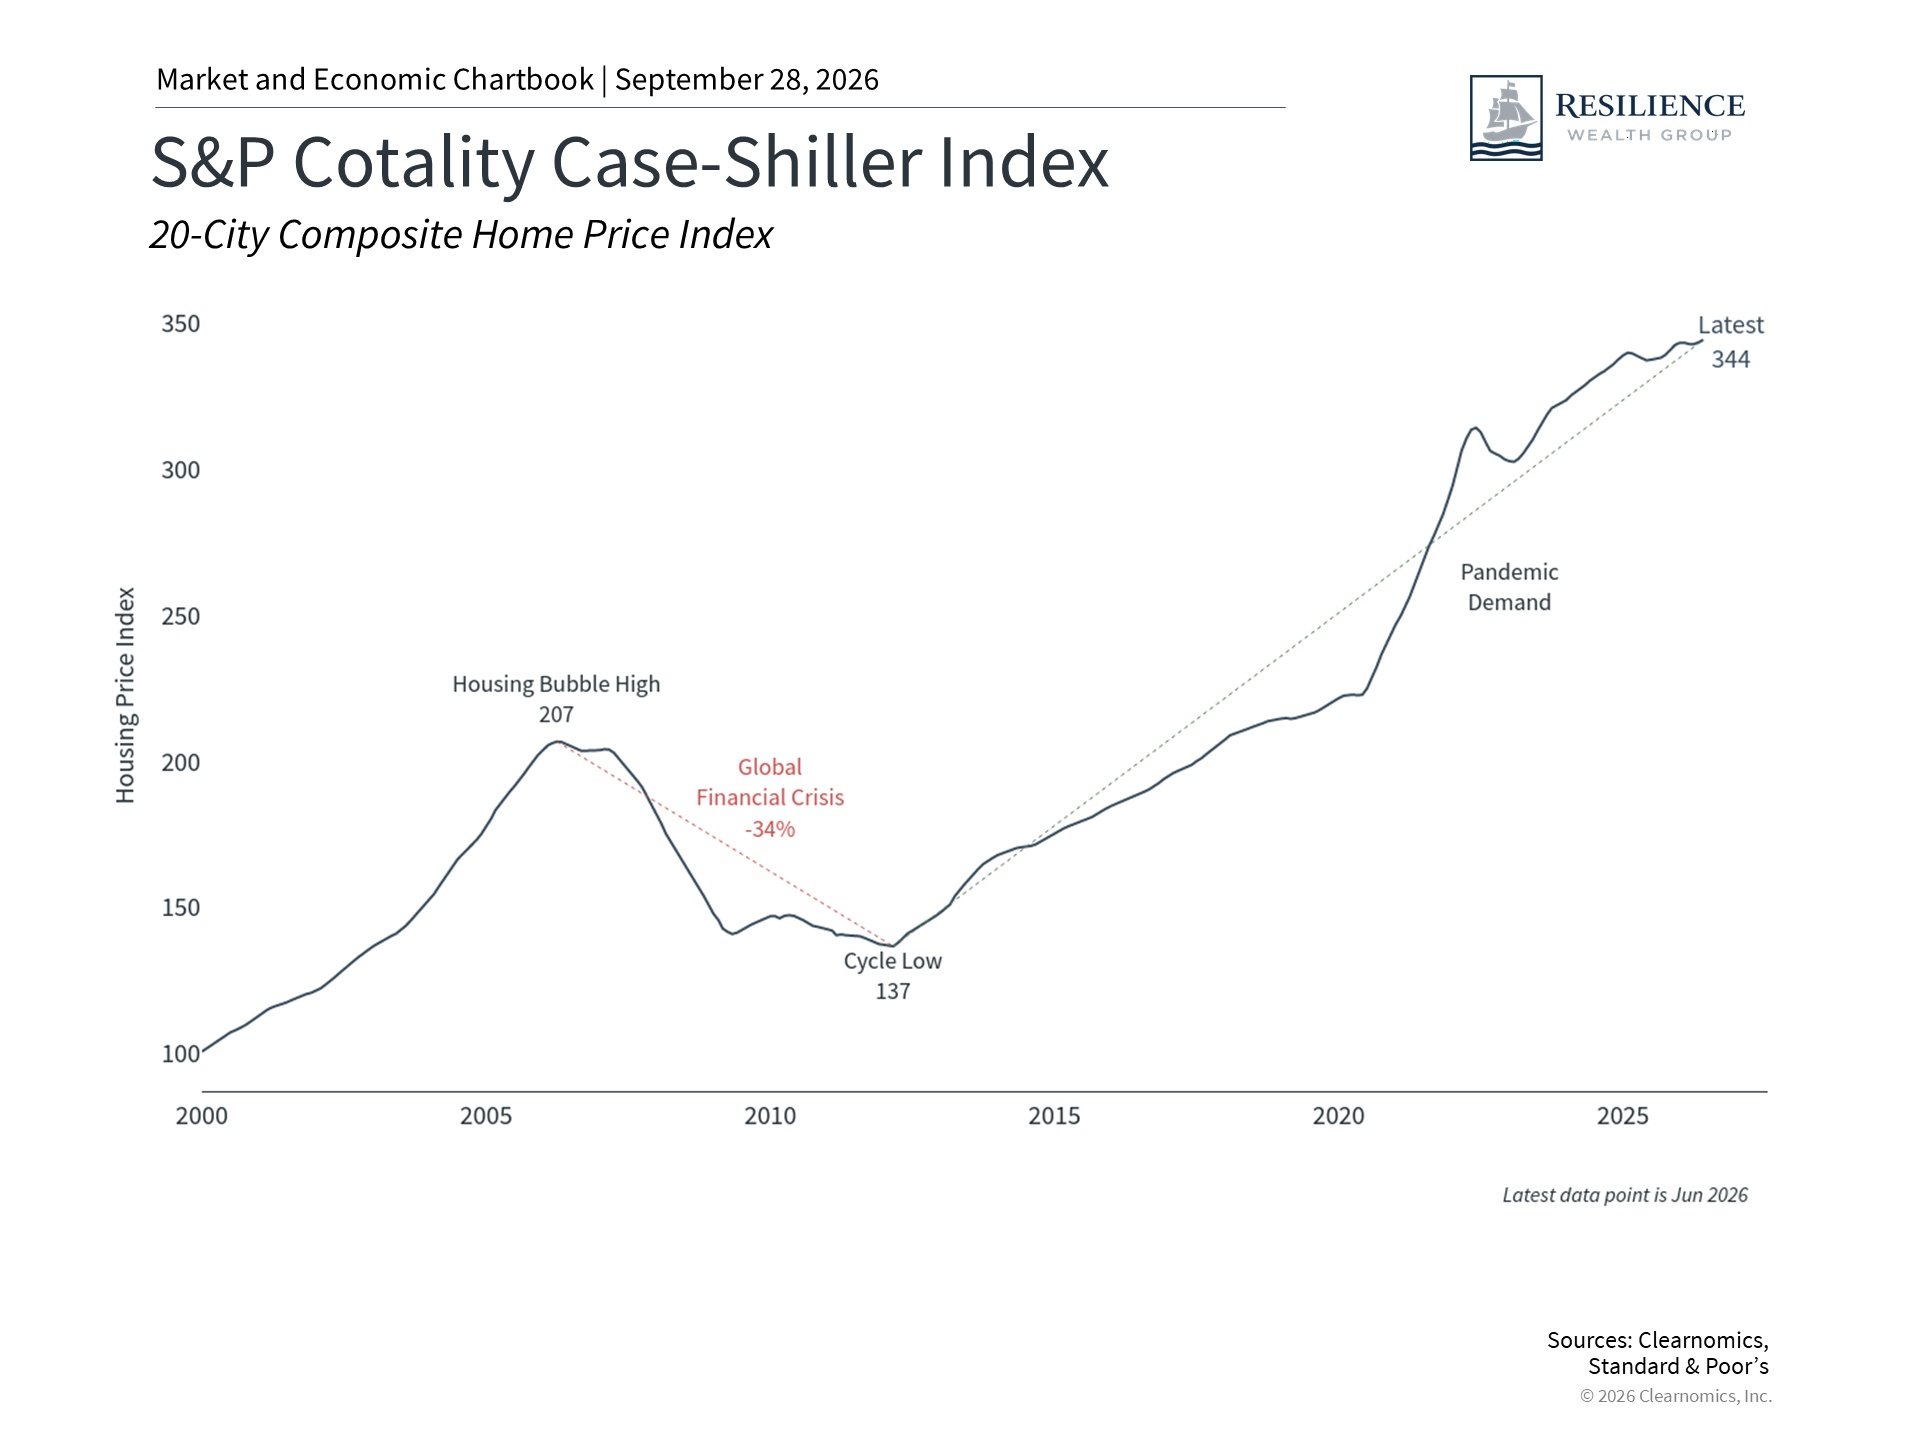 |
Even as transaction volumes remain low, home prices nationally continue to hover near record highs according to the S&P Cotality Case-Shiller Index, as shown in the chart above. It is not uncommon for activity and prices to move in different directions in the housing market. The overall economy remains healthy and unemployment is low, creating an environment in which existing homeowners are financially capable of maintaining their mortgage payments and staying in their homes without feeling compelled to move.
Elevated home prices also contribute to what is commonly referred to as the "wealth effect." When households perceive that their homes are holding their value or appreciating, they tend to feel more financially secure. With the stock market also hovering near all-time highs, these trends can encourage greater spending on goods and services.
These dynamics may also help explain why consumer spending has proven more resilient than many economists anticipated, despite headwinds such as tariffs and higher energy costs. This has remained true even as consumer sentiment has stayed near historic lows. One of the notable puzzles of recent years has been the disconnect between how consumers describe their feelings about the economy and how much they actually spend.4
One explanation is that sentiment is shaped more by inflation driven by factors such as higher gasoline prices this year, while spending is supported by the wealth effect. Housing costs represent an important portion of household finances, making up more than one-third of the Consumer Price Index. However, these "shelter" costs have increased only 3% over the past year, while gasoline prices have surged 27.4%.5
Refinancing activity has dropped sharply as rates have risen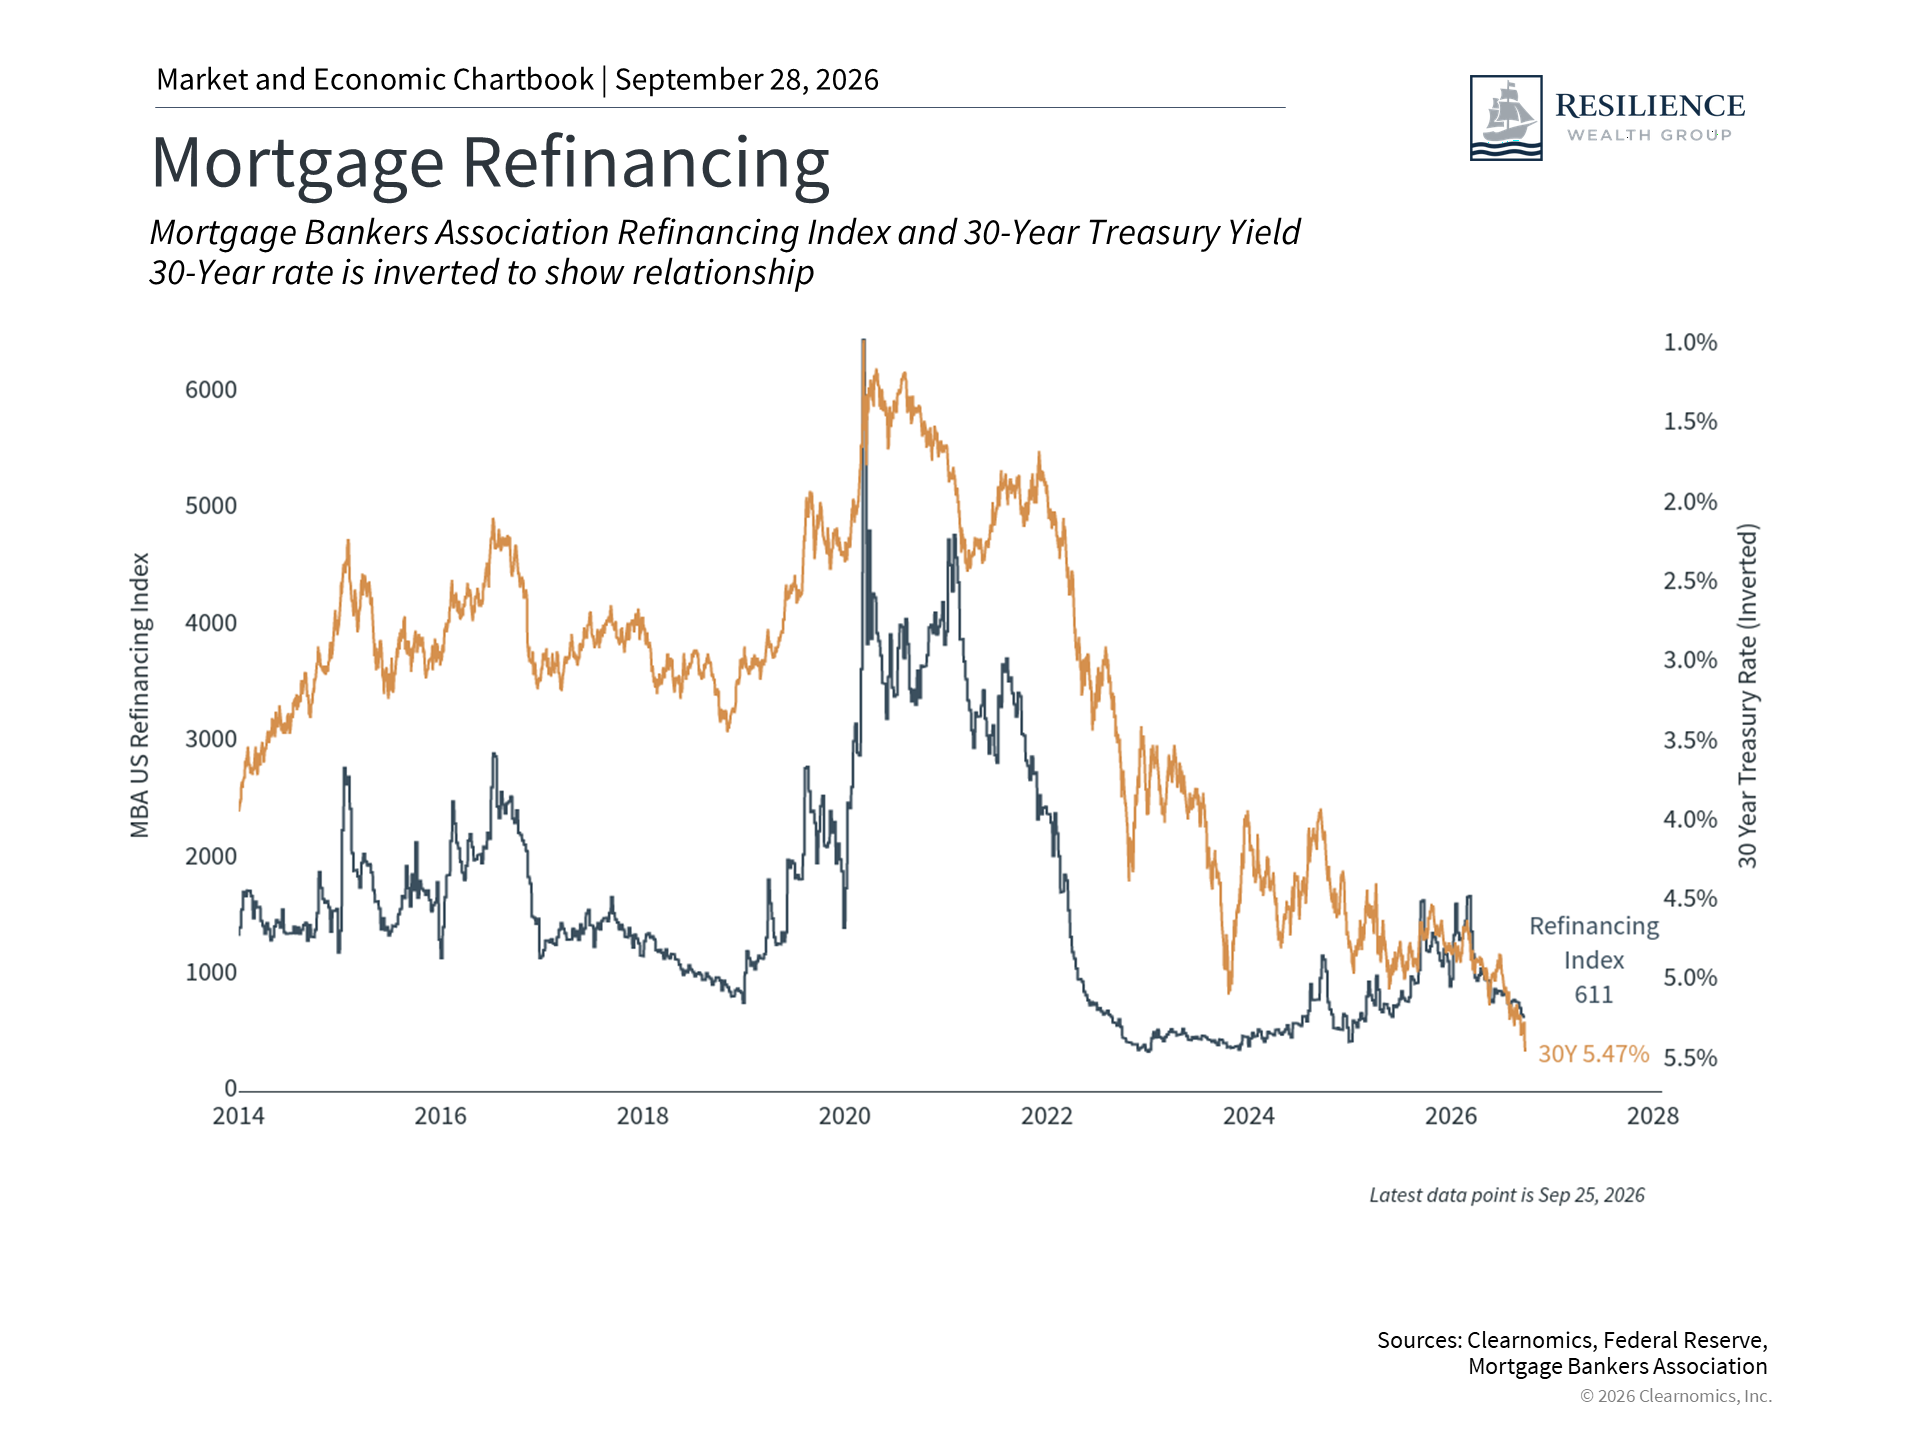 |
As long-term interest rates have climbed, it is unsurprising that refinancing activity has fallen sharply as well. Data from the Mortgage Bankers Association shows that refinancing volumes have declined to multi-year lows after peaking between 2020 and 2022, when many homeowners took advantage of historically low rates to reduce their monthly payments or access home equity.6
In practical terms, homeowners who might otherwise have refinanced are no longer able to do so at attractive rates. Because refinancing can be a mechanism through which households convert rising home values into spendable cash, this trend has the potential to weigh on consumer spending going forward.
Mortgage debt remains by far the largest component of household borrowing, even as credit card and student loan balances have grown in recent years. Household debt service as a share of disposable income, which includes both mortgage and consumer debt, stood at approximately 11% in the second quarter of this year. This is still moderate relative to the pre-2008 peak of nearly 16%, suggesting that most households are managing their debt loads even if they cannot readily access their home equity.7
The extent to which spending, home prices, and transaction volumes are affected will ultimately depend on how long interest rates remain elevated. At present, many interest rates across maturities are near twenty-year highs, including 5-year, 10-year, and 30-year Treasury yields.8 With inflation remaining stubbornly above the Fed's target, bond yields suggest that rates may stay higher for longer. The Fed's own quarterly Summary of Economic Projections also indicates that policy rates could remain elevated through at least 2027.9 Although interest rates are inherently difficult to forecast, particularly given potential new developments in inflation, oil prices, and the job market, investors and households would do well to remain disciplined and focused on their long-term financial plans.
The bottom line? The housing market is likely to continue feeling the effects of elevated interest rates as mortgage rates push past 7%. For investors, this environment of higher rates underscores the importance of remaining vigilant and maintaining a focus on long-term planning.
References
1. https://www.nahb.org/news-and-economics/housing-economics/housings-economic-impact/housings-contribution-to-gross-domestic-product
2. https://www.nar.realtor/newsroom/nar-existing-home-sales-report-shows-2-0-decrease-in-august
3. https://www.nar.realtor/research-and-statistics/housing-statistics/existing-home-sales
4. https://www.sca.isr.umich.edu/
5. https://www.bls.gov/news.release/cpi.nr0.htm
6. Clearnomics research and the Mortgage Bankers Association, as of September 28, 2026
7. Clearnomics research and the Federal Reserve Economic Data, as of September 28, 2026
8. https://home.treasury.gov/policy-issues/financing-the-government/interest-rate-statistics
9. https://www.federalreserve.gov/monetarypolicy/fomcprojtabl20260916.htm
Index Descriptions
S&P Cotality Case-Shiller Home Price Indices
The S&P Cotality Case-Shiller 20-City Index measures the value of residential real estate and tracks changes in the selling prices of single-family homes across 20 major U.S. metropolitan areas.